Business Analysis Case Study 4: Defining KPIs & Reporting Framework for Executive Dashboards
Industry:
B2B SaaS – The client’s leadership team was scaling rapidly and needed a clear, centralized view of revenue performance, sales efficiency, and marketing contribution. While multiple dashboards existed, they were inconsistent, overly complex, and failed to answer the core questions executives cared about.
Problem:
The executive team lacked a reliable, high-level reporting view that could drive strategic decisions. Key challenges included:
- Disjointed dashboards across marketing, sales, and customer success, with conflicting metrics.
- Overly tactical or irrelevant KPIs being surfaced to leadership.
- Lack of alignment on which metrics actually indicated business health.
- Time-consuming manual reporting processes and one-off data pulls before each board meeting.
Solution:
We led a KPI strategy and reporting framework engagement, working directly with stakeholders to define what success looked like, which metrics mattered, and how data should be visualized at the executive level. This work laid the foundation for an automated BI dashboard that leadership could trust.
Execution:
- Stakeholder Discovery – Interviewed executive team members across finance, marketing, sales, and CS to identify their core decision-making needs.
- KPI Definition Workshop – Facilitated alignment sessions to define and standardize business-critical metrics (e.g. ARR, churn, CAC, pipeline coverage, win rate).
- Metric Prioritization – Used business impact and decision relevance to reduce noise and focus on the 12–15 most meaningful KPIs.
- Source-of-Truth Mapping – Identified where each metric would be sourced from (Salesforce, HubSpot, financial systems) and ensured consistency.
- Reporting Framework Design – Created a layered reporting model: executive summary, department rollups, and drill-downs.
- Collaboration with BI Team – Partnered with data analysts and developers to translate the business requirements into a Looker Studio dashboard.
Challenges & Roadblocks:
- Metric Misalignment – Different teams had different formulas for the same KPIs (e.g. CAC), requiring consensus and documentation.
- Information Overload – Leadership was previously overwhelmed by detailed dashboards with too many filters and tabs.
- Tool Confusion – Multiple tools were being used to track the same metrics, making trust difficult.
- BI Team Bottlenecks – Business requirements needed to be clear and prioritized to avoid delays in dashboard development.
Results:
- Reduced time spent on manual reporting by 70%.
- Created a single, executive-facing dashboard used consistently for board prep, revenue reviews, and strategic planning.
- Increased confidence in metrics across departments by establishing one source of truth.
- Improved alignment between business objectives and operational execution through clear KPI tracking.
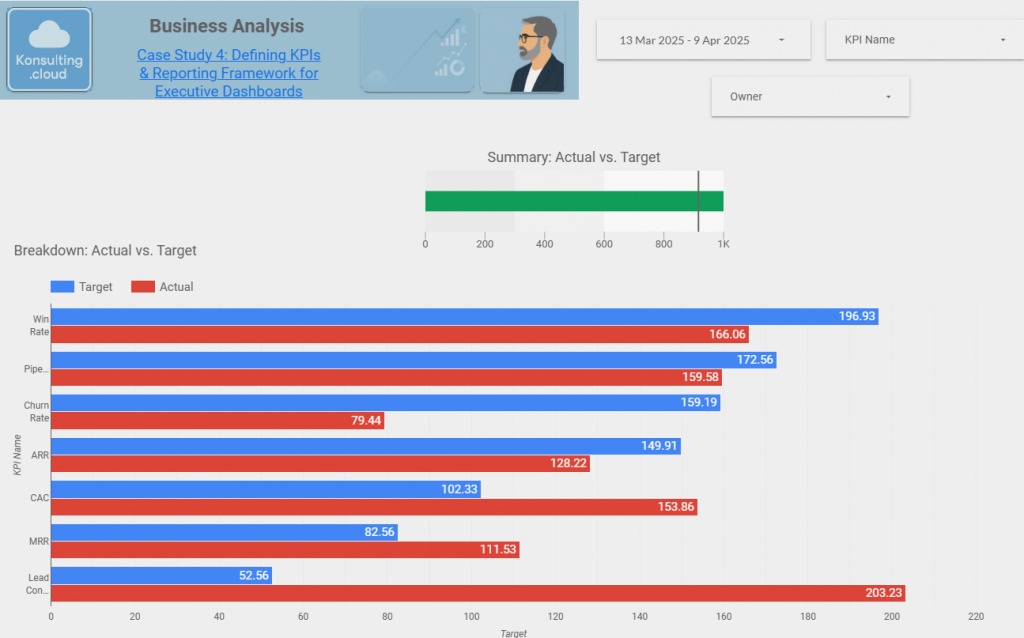
Dashboard:
Key Takeaways & Learnings:
- Dashboards are only as good as the KPIs they show—clarity starts with the right questions.
- Business analysts play a crucial role in bridging leadership needs and data delivery.
- KPI alignment creates trust, and trust enables faster, more confident decision-making.
- Less is more—a focused executive dashboard beats a complex one that nobody uses.
Related Case Study:
Analytics Case Study 4: BI Dashboard for Executive Revenue Reporting