Analytics Case Study 6: Auditing Performance Measurement Across the Organization
Industry:
B2B SaaS – The client was scaling quickly, with mature teams in marketing, sales, customer success, and product. Despite strong functional output, each team measured success differently, leading to siloed insights, misaligned goals, and inconsistent reporting at the leadership level.
Problem:
There was no unified strategy for how performance was defined, tracked, or reported. Key issues included:
- Conflicting KPI definitions across departments (e.g. multiple versions of “conversion rate,” “pipeline coverage,” etc.).
- Redundant dashboards with unclear ownership and inconsistent data sources.
- Limited executive visibility into core business drivers like customer acquisition cost (CAC), pipeline velocity, and churn.
- Difficulty aligning teams around shared priorities due to fragmented reporting structures.
Solution:
We conducted a strategic performance measurement audit and built a cross-functional analytics framework grounded in business objectives. The goal was to align every team’s metrics with company-wide outcomes and create a single source of truth for performance reporting. The solution included:
- Mapping current metrics and reports to stakeholder needs and business goals.
- Standardizing KPI definitions and aligning them to a unified data layer.
- Designing a measurement strategy that tied operational metrics to financial outcomes.
- Implementing role-based dashboards for leadership, marketing, sales, and CS teams.
Execution:
- Stakeholder Discovery – Led structured interviews across departments to uncover reporting needs, decision workflows, and current pain points.
- Analytics Inventory – Audited dashboards, spreadsheets, and ad hoc reports across Looker Studio, Salesforce, HubSpot, and Excel.
- KPI Rationalization – Defined consistent, business-aligned KPIs with clear data sources, ownership, and usage guidelines.
- Measurement Framework Design – Built a performance hierarchy connecting daily metrics to quarterly business goals.
- Data Governance Alignment – Defined source-of-truth systems and established rules for reporting ownership and update cadence.
- Enablement & Rollout – Created documentation, conducted training sessions, and transitioned teams to the new framework.
Challenges & Roadblocks:
- KPI Politics – Negotiating and reconciling different versions of success metrics across departments.
- Siloed Reporting Tools – Bridging the gap between tools and teams with different reporting habits.
- Lack of Visibility into Customer Journey – Some metrics (like CAC by source) required new data stitching and process changes.
- Organizational Change Management – Shifting from team-owned metrics to shared business goals required top-down and bottom-up alignment.
Results:
- Unified performance reporting across marketing, sales, and CS under a single strategic framework.
- Reduced dashboard sprawl by 70%, eliminating redundant and conflicting reports.
- Increased executive confidence in reporting, enabling faster, better-informed decisions.
- Improved cross-functional alignment by linking operational efforts to financial outcomes.
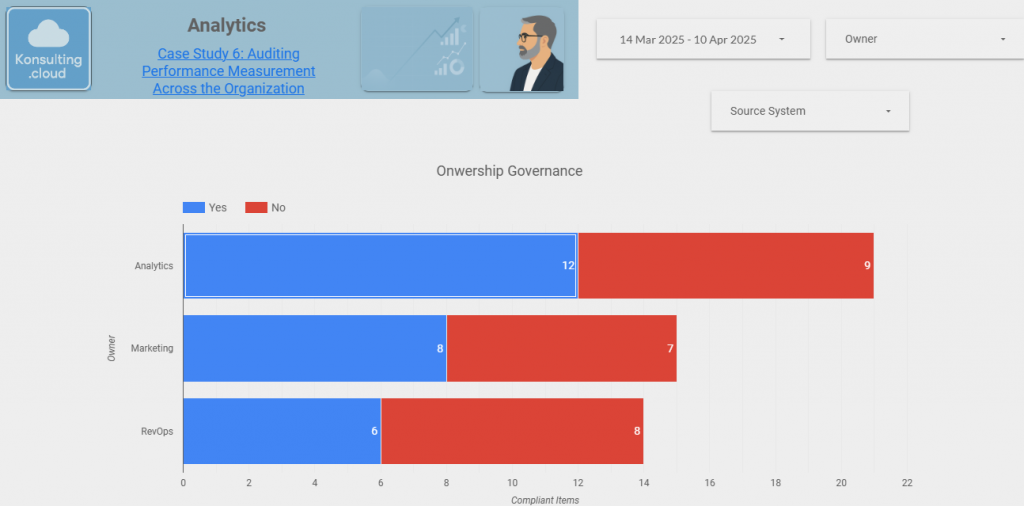
Dashboard:
Key Takeaways & Learnings:
A unified performance framework becomes a growth enabler, not just a reporting tool.
Business analysis is the bridge between data and decision-making—clear KPIs drive alignment and accountability.
A measurement strategy is not just about metrics—it’s about clarity of goals and shared understanding.
Cross-functional buy-in and facilitation skills are critical when defining what success actually means.