Analytics Case Study 5: Data Strategy – Laying the Foundation for Scalable Insights
Industry:
B2B SaaS – The client had a growing tech stack that included Salesforce, HubSpot, Looker Studio, and several product analytics tools. While data was abundant, it was siloed, inconsistently named, and often mistrusted. As the organization scaled, the lack of a cohesive data strategy became a blocker to reliable reporting and efficient cross-team collaboration.
Problem:
The company had no formal data governance or strategy in place, which led to:
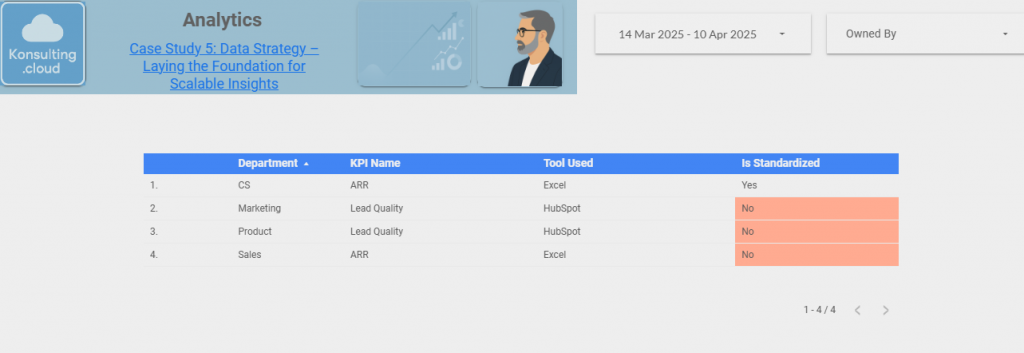
- Conflicting reports and multiple versions of the same metrics.
- Inconsistent naming conventions, making it hard to build and maintain dashboards.
- Poor data lineage visibility—teams didn’t know where metrics came from or how they were calculated.
- Redundant manual work due to lack of shared definitions, standards, and documentation.
Solution:
We implemented a foundational data strategy framework focused on governance, naming conventions, documentation, and source-of-truth clarity. This provided the backbone for accurate reporting, easier dashboard maintenance, and confident decision-making. The solution included:
- Establishing a source-of-truth system for core business metrics.
- Creating and implementing standardized naming conventions across data layers.
- Developing a centralized data dictionary for shared understanding across teams.
- Setting up version control and change management processes for metrics and dashboards.
Execution:
- Data Landscape Audit – Mapped all existing data pipelines, dashboards, and key metrics across systems.
- Governance Framework Design – Defined roles, responsibilities, and workflows for maintaining data quality.
- Naming Conventions & Taxonomy – Standardized naming for events, metrics, and dimensions across systems.
- Source-of-Truth Planning – Identified which tools would own key data sets (e.g. Salesforce for customer data, HubSpot for MQLs).
- Data Dictionary Development – Built a shared documentation hub outlining metric definitions, data lineage, and owner info.
- Enablement & Governance Rollout – Trained stakeholders and implemented a review process for any new metrics or dashboards.
Challenges & Roadblocks:
- Legacy Debt – Old reports and dashboards used inconsistent logic, requiring cleanup and deprecation.
- Tool Overlap – Multiple platforms had overlapping definitions for the same KPIs, causing confusion.
- Cultural Shift – Moving from a “just build it” mindset to a governed data process required change management.
- Documentation Fatigue – Encouraging teams to contribute and maintain the data dictionary required clear incentives and ownership.
Results:
- Reduced reporting discrepancies by 80% through a single source-of-truth framework.
- Increased team efficiency by 40% through standardized naming and reduced duplication.
- Cut dashboard maintenance time in half by implementing clear ownership and versioning.
- Created a scalable data foundation that supported faster onboarding and better cross-team alignment.
Dashboard:
Key Takeaways & Learnings:
- A strong data strategy is invisible when it’s working—but painful when it’s missing.
- Governance, consistency, and documentation are key enablers of self-service analytics and data trust.
- Early investment in naming conventions and source-of-truth planning saves hundreds of hours later.
- Data strategy is not just technical—it’s cultural. Success depends on cross-functional collaboration and clear processes.