Analytics Case Study 2: Marketing Attribution Dashboard
Industry:
B2B SaaS – The client ran marketing campaigns across multiple channels—paid search, paid social, webinars, content marketing, and email—but lacked visibility into which efforts were driving pipeline and revenue. Attribution reporting was fragmented, leading to misaligned budget decisions and unclear ROI.
Problem:
The marketing team struggled to connect campaign performance with downstream pipeline and revenue impact. Key issues included:
- Disconnected data sources across Google Ads, LinkedIn, HubSpot, and Salesforce.
- Inconsistent attribution models, resulting in over-crediting last-touch efforts.
- Limited ability to track full customer journeys and multi-channel influence.
- Leadership lacked confidence in marketing ROI and was hesitant to invest further.
Solution:
We developed a centralized marketing attribution dashboard in Looker Studio to unify data and visualize the true impact of each channel and campaign. The solution included:
- Consolidating marketing and CRM data into a unified model.
- Applying a custom attribution model (blended linear/time decay) to fairly credit touchpoints.
- Visualizing key KPIs such as channel ROI, cost per MQL, and revenue influence.
- Creating views tailored for CMOs, performance marketers, and RevOps teams.
Execution:
- Data Mapping & Source Integration – Connected Google Ads, LinkedIn, HubSpot, and Salesforce via connectors and ETL processes.
- Attribution Logic Design – Defined business rules for multi-touch attribution, considering both online and offline engagement.
- Dashboard Buildout – Designed interactive dashboards in Looker Studio with filters by channel, campaign, buyer persona, and lifecycle stage.
- Validation & QA – Conducted backtesting and validation to ensure attribution models reflected real funnel dynamics.
- Stakeholder Enablement – Hosted working sessions with marketing and leadership teams to walk through insights and use cases.
Challenges & Roadblocks:
- Attribution Model Disputes – Aligning teams on how credit should be distributed required cross-functional workshops.
- Data Consistency Issues – CRM campaign tagging was inconsistent, requiring a retroactive clean-up for reliable reporting.
- Offline Activities – Accounting for events, outbound calls, and referrals required manual data enrichment.
- Adoption – Encouraging teams to shift from vanity metrics to revenue-based KPIs took education and repetition.
Results:
- Improved visibility into channel performance, allowing reallocation of 20% of the marketing budget to high-ROI channels.
- Increased MQL quality by 18% through better-informed campaign decisions.
- Enabled leadership to confidently tie marketing spend to revenue, strengthening future planning.
- Reduced manual reporting time by 60%, freeing up analysts for strategy work.
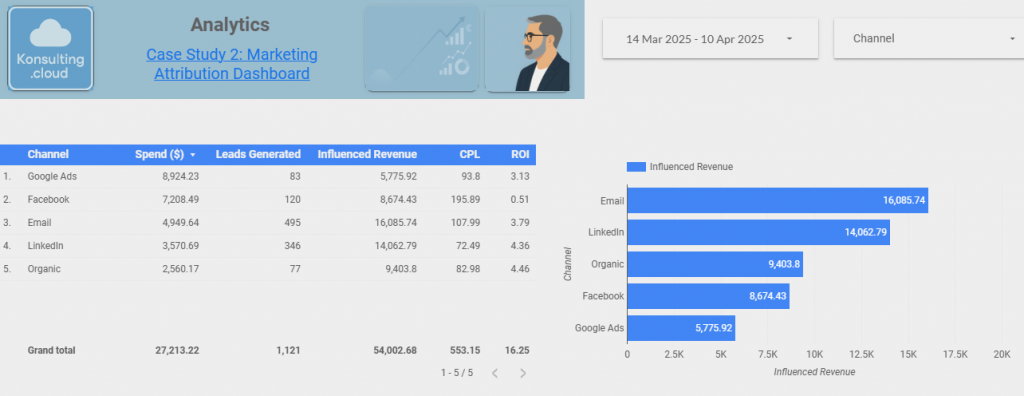
Dashboard:
Key Takeaways & Learnings:
Marketing teams become more strategic when they have access to real-time, revenue-focused insights.
A well-structured attribution dashboard brings clarity and alignment across marketing, sales, and finance.
Blended attribution models more accurately reflect the complexity of modern buyer journeys.
Data integrity and tagging discipline are foundational to reliable attribution reporting.